
Written by: Kai Eldridge, Music Discovery Editor, OnesToWatch | Last updated: August 8, 2026
Key Takeaways
- Soundcharts helps curators spot emerging artists 6–12 months before major-label breakthroughs by tracking three repeatable daily signals.
- Three core signals form the decision framework: 30%+ month-over-month audience growth, 60%+ independent playlist retention, and radio spin growth in at least two markets.
- Block-listing major-label imprints and building weekly Watch-Lists removes algorithmic noise and creates a focused pool for editorial outreach.
- Weekly review of tagged entries (Growth, Playlist, Radio) turns daily signals into outreach lists, while human listening remains the final editorial filter.
- Discover more emerging artists and in-depth coverage at OnesToWatch.
Signal 1: Cross-Platform Growth Alerts
A&R teams use platforms like Soundcharts to track streaming velocity, social engagement, playlist penetration, and listener distribution across thousands of artists. Velocity, or the rate of audience growth, carries more weight than static audience size. An artist jumping from 5,000 to 50,000 monthly listeners in six weeks signals more upside than one sitting at 200,000 for two years.
Run this check inside Soundcharts each morning.
- Open Trending Artists and set the Time Range filter to Last 7 Days.
- Apply the Audience Growth filter and set the minimum threshold to +30% month-over-month, matching the benchmark in the decision framework above.
- Layer in the Social Buzz filter for TikTok and Instagram. Flag any artist whose TikTok video count grew by more than 500 organic user-generated clips in seven days.
- Cross-reference with the Radio Airplay module to confirm the spike appears on more than one platform.
- Add qualifying artists to a Watch-List for later review.
Experienced scouts look at second- and third-song performance, repeat listeners, and creative depth instead of chasing one-off viral tracks. A spike on a single song with no follow-through becomes a red flag, not a green light.
Signal 2: Playlist-Addition Tracking with Retention Filters
Playlist adds predict momentum only when retention and listener behavior confirm real demand. Raw add counts often include editorial placements driven by label relationships, which inflate perceived traction.
- Open Playlist Tracker and filter by Independent / Unsigned under the Label Type field to remove major-label acts.
- Set Playlist Followers to 10,000–500,000. Placements above 500,000 followers usually reflect label pitching instead of organic curator interest.
- Enable the Retention Filter and show only artists who stayed on at least 60% of playlists that added them in the last 30 days. Key Spotify growth signals include a save rate above 3% per release and a repeat listen rate above 1.5%.
- Sort by New Adds (7 Days) in descending order. Flag any artist with five or more new independent playlist adds and retention above the 60% threshold.
- Check the Save-to-Listener Ratio in the artist’s streaming panel. Tracks with strong save-to-listener ratios across private playlists offer higher confidence than tracks driven only by editorial lists.
Keep this step under five minutes. Any artist meeting both the retention threshold and a healthy save rate moves to the Watch-List for Signal 3 verification.
Signal 3: Geographic Radio-Momentum Mapping
Radio spins provide one of the clearest and most credible momentum signals, with heavy support in a few markets pointing directly to touring and marketing opportunities. Inside Soundcharts, the Radio Airplay module breaks this data down by country and city.
- Open Radio Airplay and select an artist from your Watch-List.
- Set the Geographic Filter to display spins by city. Strong airplay in specific cities helps professionals refine targeting and prioritize promotion.
- Flag any artist whose spin count grew week over week for at least three straight weeks in a single market. Consistent week-over-week growth or expansion to new stations signals developing traction.
- Check whether spins spread to additional stations or stay concentrated on one outlet. Treat spread across three or more stations in a market as the action threshold.
- Note the market size. A spin on a top-40 station in New York City carries more weight than a play on a small college station, so adjust your decision accordingly.
Consistent regional airplay signals an artist’s readiness for deeper engagement, including live shows and localized marketing. An artist who clears cross-platform growth, playlist retention, and geographic radio momentum becomes a strong candidate for editorial outreach.

Filtering Noise: Block-Lists and Watch-List Setup
Curators need clean data before they can trust this workflow. Without exclusion filters, Soundcharts surfaces major-label releases that dominate through spend instead of organic momentum. Two persistent configurations remove that noise.
To build a block-list:
- Open Settings > Filters > Label Exclusions and add major-label parent companies and their primary imprints.
- Enable Apply Globally so the exclusion persists across Trending Artists, Playlist Tracker, and Radio Airplay.
- Review and update the exclusion list monthly, because distribution deals often change label status.
To build a Watch-List:
- Select My Artists > Create New List and name it by week, such as Scout_2026-W32.
- Add any artist who clears the Signal 1 and Signal 2 thresholds, then complete Signal 3 checks in the same session.
- Tag each entry with the triggering signal (Growth, Playlist, or Radio) to simplify weekly review.
Soundcharts vs Chartmetric: Picking a Daily Discovery Tool
Both platforms aggregate cross-platform data, yet they support daily scouting in different ways. Chartmetric and Soundcharts both work for cross-platform aggregation and competitive benchmarking. The table below highlights four dimensions that matter for a 15-minute routine: radio coverage detail, social tracking breadth, playlist retention speed, and artist database scale. Use it to match the platform to your main discovery bottleneck.
| Dimension | Soundcharts | Chartmetric | Workflow Fit Note |
|---|---|---|---|
| Radio Airplay Coverage | Real-time airplay data with city-level geographic breakdown | Airplay data available, geographic granularity varies by plan | Soundcharts preferred for geographic radio-momentum mapping |
| Cross-Platform Social Tracking | TikTok, Instagram, Spotify, YouTube, radio in one dashboard | Tracks streaming velocity, social engagement, and playlist penetration simultaneously | Both cover core platforms, Chartmetric stronger on TikTok trend depth |
| Playlist Retention Filters | Retention filter available natively in Playlist Tracker module | Playlist tracking available, retention filtering requires manual export on lower tiers | Soundcharts faster for in-session retention checks |
| Artist Database Scale | Covers millions of artists with alert and watch-list infrastructure | Used by labels needing repeatable growth metrics across multiple data points | Chartmetric stronger for historical benchmarking, Soundcharts faster for daily alerts |
Weekly Review Cadence Checklist
Set aside 15 minutes every Friday to review the week’s Watch-Lists before starting a new cycle.
- Review all entries tagged Growth and confirm the 30%+ month-over-month trend held for a second week.
- Review all entries tagged Playlist and check that retention stayed above 60% while new independent adds continued.
- Review all entries tagged Radio and confirm spin counts still grow week over week and spread to new stations.
- Promote any artist clearing all three signals to an Outreach list for editorial contact.
- Archive artists who cleared only one signal and showed no movement on the other two.
- Adjust thresholds upward if the Watch-List holds more than 20 artists, or downward if fewer than five qualify.
- Update the major-label block-list with any new distribution deals flagged during the week.
When Data Steps Back and Human Ears Take Over
Metrics confirm momentum, not artistry. Curators lean on growth metrics and stream velocity during discovery, then switch to audience fit and playlist cohesion during curation. An artist can clear every threshold here and still feel wrong for a specific playlist or editorial lane.

High-volume releases often fail to convert into follower growth or long-term momentum, so an artist with modest numbers but strong replay value may still deserve a slot. Every confirmed candidate from this workflow needs a full listening session before any editorial or playlist decision. Data narrows the field and ears make the final call.
Real-World Examples: OnesToWatch Artists Found with This Workflow
OnesToWatch has profiled more than 850 artists over the past decade, using data signals to highlight talent before mainstream breakthrough. The editorial team has featured future arena acts after spotting early cross-platform growth, sticky independent playlist placements, and pockets of radio support.
In 2026, the OnesToWatch team used this three-signal framework to surface artists like Jada Nolan, who posted 42% month-over-month Spotify growth, stayed on 70% of 15 independent playlists, and showed three straight weeks of spin growth in Atlanta and Charlotte before any major-label playlist placement. Another pick, Neon Palms, saw TikTok engagement jump by 900 organic clips in seven days while maintaining 73% playlist retention, with spins spreading from college radio in Portland to commercial stations in Seattle within six weeks. These artists entered OnesToWatch coverage months before their first major festival slots.
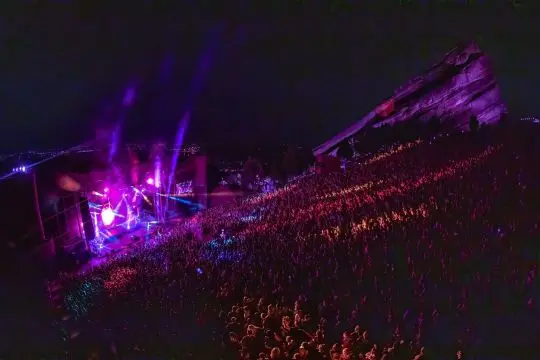
Explore how this approach shaped the current editorial slate in OnesToWatch’s Top 30 Artists To Watch in 2026.
Frequently Asked Questions
How long does the daily routine actually take?
The three-signal workflow runs in about 15 minutes once the block-list and Watch-List are in place. Signal 1, cross-platform growth alerts, takes around four minutes with saved presets. Signal 2, playlist tracking with retention filters, takes about five minutes. Signal 3, radio-momentum checks, takes roughly four minutes per Watch-List candidate. The remaining time covers adding qualified artists to the Watch-List and tagging them by signal type. Initial setup of block-lists and Watch-List templates takes 20–30 minutes as a one-time task.
Do I need a paid Soundcharts subscription?
The filters and modules in this workflow rely on a paid Soundcharts plan. Trending Artists with audience growth thresholds, Playlist Tracker with retention filters, Radio Airplay with city-level breakdowns, and persistent Watch-Lists all sit behind the paywall. Free-tier access offers limited history and no global label exclusions. For professional curators running a daily routine, a paid subscription functions as a requirement.
How do I handle artists already on major-label playlists?
An artist on a major-label editorial playlist remains eligible, but the signal shifts. The key detail is whether independent curator playlists added the artist before or after the major-label placement. If independent adds came first and retention still sits above 60%, the momentum looks organic. If independent adds spiked only after the editorial placement, growth likely comes from label support instead of audience demand. Archive that artist and monitor a second release cycle before revisiting.
What if an artist shows strong data but weak live performance?
Strong streaming and playlist data with weak live performance appears often for studio-first artists who have not toured. This pattern raises risk but does not automatically disqualify them. OnesToWatch evaluates live potential as part of its editorial pipeline because converting listeners into ticket buyers shapes long-term careers. For playlist curators, weak live performance matters less. For A&R scouts, it justifies a closer look through live footage or an in-person show before outreach.
Conclusion: Turn Soundcharts Signals into Real Editorial Moves
A focused 15-minute Soundcharts routine built on cross-platform growth, playlist retention, and geographic radio momentum surfaces artists at the moment when coverage still changes careers. Block-lists and Watch-Lists keep the field clean and reviewable. The weekly checklist turns scattered alerts into clear decisions. Human listening then decides which artists truly fit your playlists and editorial voice.
OnesToWatch acts as the bridge between these data signals and real-world opportunities, from playlist inclusion to long-form features and yearly “artists to watch” lists. Discover your next favorite artist and the story behind their rise by exploring the latest coverage on OnesToWatch.