
Written by: Kai Eldridge, Music Discovery Editor, OnesToWatch | Last updated: August 18, 2026
Key Takeaways
- Chartmetric and similar AI A&R tools reach about 72–78% predictive accuracy for mainstream genres and fall below 50% for niche, regional, and long-cycle artists.
- Over 80% of tracks with early algorithmic placement lose more than 70% of daily streams within 28 days, which exposes labels to costly false-positive signings.
- Data-only pipelines overlook subcultural breakouts, diaspora artists, and unconventional song structures that build audiences outside streaming metrics.
- Human curation through live performance assessment, catalog review, and cultural context remains the decisive layer that dashboards do not replicate.
- Discover emerging artists through OnesToWatch’s hybrid editorial process that pairs data monitoring with expert human judgment.
The Problem: How Data-Only A&R Wastes Artist Budgets
Labels have signed acts based on viral moments that failed to translate into sustainable careers. Artists who generate two million streams in a week from a single TikTok trend only prove that a moment landed. They do not prove that the artist can sustain an audience. The pattern repeats: a spike in monthly listeners, a surge in follower growth, a playlist add wave, then a 90-day stall as the algorithmic boost fades.
Over 80% of tracks that receive algorithmic placement in their first week lose more than 70% of their daily streams within 28 days, according to Spotify’s Loud & Clear 2025 report. When label budgets ride on that first-week signal alone, the financial risk becomes significant. Understanding where these tools succeed and fail starts with a closer look at their accuracy across genres.
Major labels in 2026 increasingly deploy AI A&R tools to back-fill signings after virality has already occurred rather than discovering artists pre-virality. This pattern implies limited long-term predictive reliability when algorithms operate alone. This reactive approach creates a secondary problem. When every label reads the same data dashboards, competitive pressure drives rushed signing decisions based on short-term visible signals instead of careful evaluation of an artist’s foundations.
Labels now expect artists to complete early independent development work because streaming economics no longer support multi-album development cycles. Purely algorithmic discovery cannot meet that bar without human assessment of artist identity, catalog depth, team strength, and development ceiling.
Chartmetric Accuracy by Genre in 2026
No single published independent audit assigns Chartmetric a precise accuracy figure. However, Chartlex analysis of more than 2,400 artist campaigns and converging trade reporting place the overall predictive accuracy of AI A&R tools, including Chartmetric Predict, Soundcharts AI Heat, Sodatone, and Instrumental, in a 72–78% range for mainstream-velocity tracking. That ceiling drops sharply by genre.
| Genre Category | Estimated Accuracy Range | Primary Signal Used | Key Limitation |
|---|---|---|---|
| Pop / Hip-Hop / Electronic | 72–78% | TikTok velocity (28% weight), Spotify Discover Weekly add-rate (18%) | Built for short-cycle virality, misses slow-burn artists |
| Indie / Alternative | 55–65% | Save rate, playlist add rate | Subcultural growth often precedes streaming data by months |
| Jazz / Classical / Ambient / Folk | Below 50% | Systematically underrepresented in algorithmic flagging | Long-cycle careers remain invisible to short-window models |
| Regional / Diaspora (Afrobeats, Amapiano, Regional Mexican) | Below 50% | Minimal streaming data until after mainstream crossover | Cross-cultural emergence appears long after scenes form |
AI trend-prediction models consistently underperform on deliberate aesthetic resistance. Tracks with long intros, unconventional structures, or abrasive textures often trigger high skip rates yet build devoted followings. These models also struggle with cross-cultural emergence and retroactive recontextualization. Short-term streaming-velocity projections can reach 95% accuracy within a one-week window when momentum already appears in data, but accuracy drops sharply beyond 30 days.
For a curated list of artists surfaced through this hybrid editorial process, explore OnesToWatch’s 2026 artist predictions.
False-Positive Signing Patterns You Can Avoid
Three structural patterns from 2025–2026 show where data-only pipelines create false positives and where human curation would have caught the mismatch.
Pattern 1: The TikTok Spike With No Catalog Depth
Labels that sign artists based solely on a viral TikTok hit or trending sound often encounter false positives. Audiences built around algorithmic trends are hard to retain once the trend passes. These contracts underperform because the artist lacks creative catalog depth or genuine audience loyalty. A dashboard that shows two million streams in week one and a 28% TikTok sound-usage curve looks like a strong buy signal. A human curator who listens to the full catalog, which might contain only two tracks built on the same trending audio template, would flag the missing artistic identity before a deal closes.
| Decision Point | Data-Only Reading | Human Curation Override |
|---|---|---|
| Week-1 streams: 2M | Strong buy signal | Investigate catalog depth before committing |
| Save rate: 1.8% | Below threshold but masked by volume | Below 2% save rate signals wrong audience or hook failure |
| Catalog: 2 tracks | Not weighted in standard dashboards | Too little evidence of sustained artistic output |
Pattern 2: Follower Inflation and Engagement Pods
Follower inflation, engagement pods, and coordinated boosting campaigns create false positives in A&R dashboards. These tactics generate engagement spikes that do not match content quality and can push follower growth beyond platform averages without a clear catalytic event. IFPI’s Global Music Report 2025 highlights streaming manipulation as a major industry issue, with bad actors generating artificial plays that distort metrics and steal revenue from legitimate artists. A human curator who attends a live show, or reviews live footage, can see within minutes whether an artist commands a room or is simply manufacturing a dashboard.

Pattern 3: The Diaspora Breakout Algorithms Miss
Subcultural or niche scenes with low digital footprints often grow through live events, word of mouth, physical media, and community spaces. These channels generate minimal streaming data until the artist already holds a strong position. University of Melbourne research that analyzed more than two million tracks found a 30% drop in Australian artists in the top 10,000 streamed in Australia, attributing this to algorithms that ignore geography. By the time a diaspora-rooted artist appears on a Chartmetric heat map, the cultural moment has usually peaked and the signing window has closed.
Why Cultural Breakouts Arrive Late in the Data
The UK government’s 2026 music streaming metadata report found that aggregators allow anyone to upload music with minimal data checks. Platform-based analytics tools inherit those upstream data errors instead of correcting them.
Deezer reported that 44% of tracks delivered daily to its platform in April 2026 were fully AI-generated, about 75,000 tracks per day. Up to 70–85% of streams on those tracks were identified as fraudulent. That fraud directly distorts the raw stream counts that feed discovery dashboards.
Spotify removed more than 75 million spammy tracks from its platform over the year leading up to September 2025. Metrics such as stream volume now carry different predictive weight for artist breakout potential than in prior years. Historical training data that Chartmetric models rely on therefore holds less long-term reliability.
Major A&R prediction tools place heavy weight on short-term TikTok velocity signals. Despite this emphasis on quick spikes, these tools still fail to capture subcultural movements that gain importance within diaspora communities before crossing linguistic or geographic boundaries. The result is a structural lag. By the time a cultural breakout shows up in streaming data, the discovery window for a meaningful early signing has usually closed.
Chartmetric vs Human A&R Judgment in Practice
AI A&R tools such as Chartmetric help major labels narrow roughly 100,000 daily Spotify uploads to a weekly list of about 50 artists for human A&R review. They do not function as standalone predictors of long-term winners. The tool narrows the field. The human completes the evaluation.
Real-world music discovery ecosystems on platforms such as Spotify and Deezer rely on mixed human-algorithmic systems for content curation and exposure. Playlist inclusion and algorithmic visibility together shape artist opportunities rather than purely algorithmic processes.
This mixed model is the approach that OnesToWatch runs at scale. The team covers about 300 artists per year through editorial features and selects around 20 for its annual “Class Of” designation. OnesToWatch applies human listening, live-performance assessment, and cultural context at every stage of the pipeline. That qualitative layer does not exist in any dashboard. The track record spans more than 850 artists across 10 years, with alumni including Billie Eilish, Chappell Roan, Olivia Rodrigo, Doechii, and Post Malone.
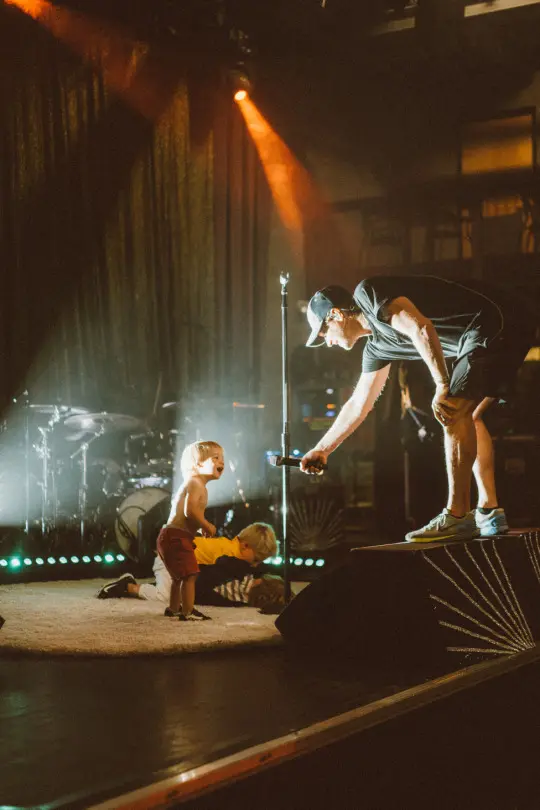
The music industry is now correcting away from the belief that data alone can replace development judgment. Labels are rebuilding creative development capacity alongside data analysis. Human curation functions as an active competitive advantage in a market where every label sees the same dashboards.
To see how this plays out in real artist choices, review OnesToWatch’s annual watchlist.
When Chartmetric Earns Its Subscription Fee
Chartmetric delivers strong value in specific, clearly defined use cases. The decision framework below separates those use cases from scenarios where human curation must lead.
Use Chartmetric for:
- Mainstream pop, hip-hop, and electronic artists already showing TikTok velocity and Spotify save rates above 4.5%. Tracks at that save-rate threshold continue to surface across personalized playlists for more than 60 days after release.
- Monitoring geographic concentration and playlist add-rate trends for artists already in your pipeline.
- Competitive intelligence on which unsigned artists are gaining traction in commercially dominant genres.
- Release timing decisions. Independent tracks released on Tuesday or Wednesday often receive more algorithmic playlist placements in their first week than those released on Friday.
Override Chartmetric with human judgment for:
- Jazz, classical, ambient, folk, and experimental artists with long-cycle career trajectories.
- Diaspora and regional artists whose cultural momentum appears before streaming data visibility.
- Artists with unconventional song structures that create high skip rates yet build devoted followings.
- Any artist whose catalog depth, live performance quality, and team infrastructure have not been independently assessed.
A niche-genre artist with 30,000 dedicated monthly listeners can sustain a stronger career than a pop artist with 300,000 casual listeners. Raw dashboard metrics will not surface that distinction without qualitative context.
For examples of artists identified through this kind of hybrid review, explore OnesToWatch’s 2026 Class Of selections.
Frequently Asked Questions
Is Chartmetric worth the cost for independent labels and managers in 2026?
Chartmetric is worth the cost for teams that need to monitor mainstream streaming velocity, track playlist add-rates, and benchmark artists against peers in commercially dominant genres. It becomes less valuable, and sometimes misleading, when used as the primary decision tool for signing artists in niche, regional, or long-cycle genres. The platform’s accuracy ceiling of 72–78% for mainstream prediction means that roughly one in four signals will be a false positive or a missed opportunity. Teams that pair Chartmetric with human editorial curation, including show attendance, catalog assessment, and live performance evaluation, consistently outperform those that rely on dashboards alone.
How does Chartmetric get its data, and why does that matter for accuracy?
Chartmetric aggregates data from streaming platforms, social media, radio, and playlist databases. It draws on signals such as Spotify stream counts, TikTok sound-usage curves, YouTube views, and playlist add-rates. The accuracy of that data depends on upstream metadata quality and the absence of artificial manipulation. The UK government’s 2026 music streaming metadata report highlighted persistent metadata problems. Separately, Deezer reported that up to 85% of streams on AI-generated tracks were fraudulent as of late 2025. Because Chartmetric inherits these upstream errors instead of correcting them, any prediction built on distorted raw data compounds that inaccuracy.
What niche-genre failures are most common when using algorithmic tools?
The most consistent failure modes appear in jazz, classical, ambient, folk, experimental, and regional diaspora genres. These genres grow through live events, word of mouth, physical media, and community spaces that generate minimal streaming data until an artist already holds a strong position. Algorithmic tools place heavy weight on TikTok velocity as their single largest factor. That structure disadvantages artists whose audiences develop over months or years rather than days. University of Melbourne research that analyzed more than two million tracks found a 30% drop in Australian artists in the top 10,000 streamed in Australia, attributing this to algorithms that ignore geography. Algorithmic pickup therefore becomes far less reliable for emerging local or regional acts. Human curation that includes live performance assessment and cultural scene knowledge remains the only reliable method for identifying these artists before mainstream crossover.
Will hybrid discovery replace pure data tools by 2027?
Industry trends point toward deeper integration of human and algorithmic judgment rather than replacement of either. Major labels already use AI A&R tools to narrow the field from 100,000 daily uploads to a shortlist of about 50 artists per week, then apply human A&R review to that shortlist. The competitive edge has shifted from finding talent first to correctly interpreting data surfaced by algorithmic tools and structuring deals quickly. Platforms such as Spotify have also moved toward retention-based scoring that rewards genuine audience connection over raw stream volume. That shift makes qualitative signals such as save rate, repeat-listen ratio, and live attendance more predictive than they were in 2023 and 2024. By 2027, labels and discovery platforms that combine real-time data monitoring with human cultural expertise will hold a structural advantage over those that rely on either approach alone.
Conclusion: Why Hybrid A&R Wins
Chartmetric and comparable platforms work well for narrowing a field of 120,000 daily uploads to a manageable shortlist. At 72–78% accuracy for mainstream genres, and materially lower for niche, regional, and long-cycle artists, they cannot serve as standalone predictors of sustainable careers. The 90-day stall pattern, the false-positive costs, and the structural data lag on cultural breakouts now appear as recurring, documented issues.
The practical answer is a hybrid framework. Algorithmic tools handle volume filtering and velocity monitoring. Human curation validates authenticity, live potential, and catalog depth. OnesToWatch’s pipeline, which filters 300 annual features to about 20 artists per year, represents that human layer operating at editorial scale. The outcomes stretch across a decade of artists from Billie Eilish to Doechii to Chappell Roan.
Data narrows the field. Human curation decides who truly belongs in it.
To see this hybrid approach in action, read through OnesToWatch’s 2026 artist lineup.